PVM Analysis
Price-Volume-Mix Analysis:
The FP&A Skill That Separates Reporters from Strategic Partners

Your CFO doesn't want to know that you missed budget. She wants to know why.
That's the difference between reporting numbers and analyzing them. And Price-Volume-Mix (PVM) analysis is one of the most powerful tools to bridge that gap.
Yet most FP&A analysts either don't use it, use it poorly, or stop at the surface level.
Let's fix that.
What Is PVM Analysis?
Price-Volume-Mix analysis breaks down revenue variance into three distinct effects:
Volume Effect: Did you sell more or fewer units than planned?
Price Effect: Did you capture more or less revenue per unit than planned?
Mix Effect: Did customers shift toward higher or lower-priced products than planned?
Here's why this matters: A revenue variance is never just one story. It's three stories tangled together. PVM untangles them.
You can beat your revenue budget while selling fewer units (price went up). You can miss budget while selling more units (customers shifted to cheaper products). You can have flat revenue while everything underneath is in chaos.
Without PVM, you're guessing. With it, you're diagnosing.
The Case: Industrial Fastener Company, Q4
Let's work through a real example.
You're the Sales FP&A lead at an industrial fastener company. You have three product categories:
Pins (Red Pin, Blue Pin, Orange Pin)
Bolts (Small, Medium, Large)
Fasteners (Plastic, Steel)
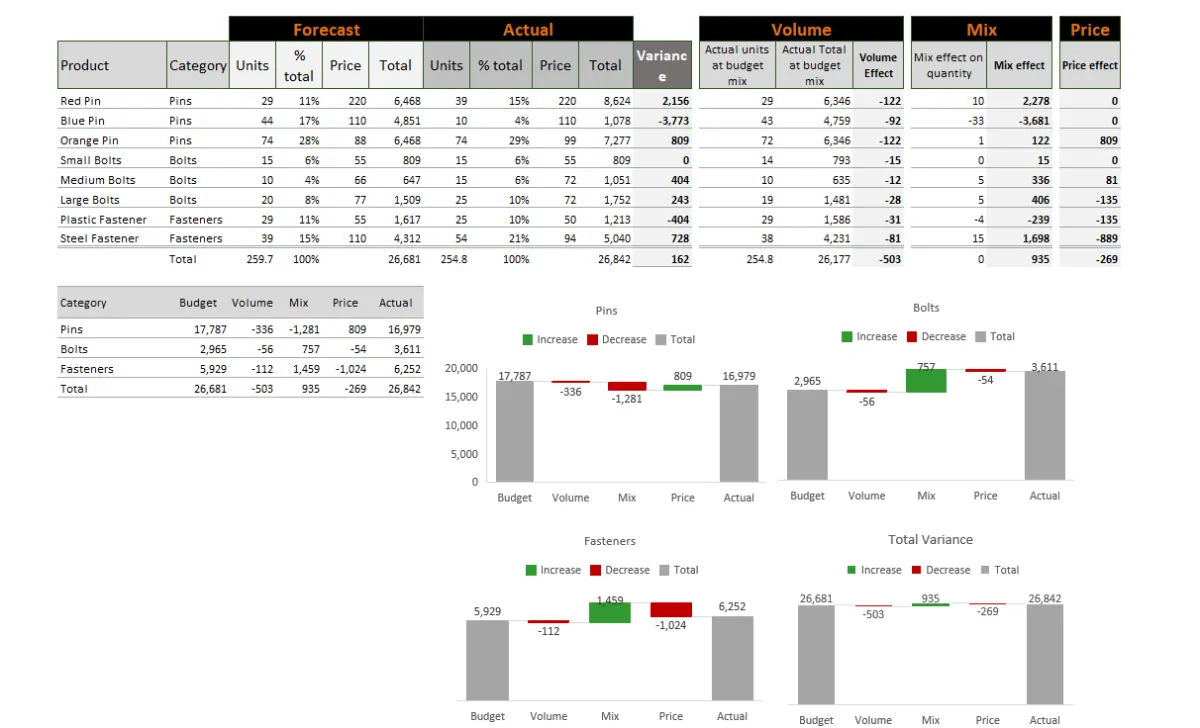
Your Q4 forecast called for $26,681 in revenue. You delivered $26,842.
On the surface: +$162 favorable variance. Nice work. Move on.
But your CFO isn't satisfied with "we beat budget." She wants to understand what actually happened—because next quarter's strategy depends on it.
Breaking Down the Variance
When you decompose the $162 favorable variance, here's what you find:
Effect Impact Volume -$503 Mix +$935 Price -$269 Net + $162
Wait. Volume was negative? Mix was almost a thousand dollars positive? What's going on?
This is where PVM analysis earns its keep.
The Volume Effect: What You Couldn't Ship
Volume Effect: -$503
You planned to ship 259.7 units. You shipped 254.8.
That 5-unit shortfall, valued at your budgeted prices and mix, cost you $503 in revenue.
But here's what the number doesn't tell you: which products drove the shortfall?
When you dig into the SKU-level data, the story emerges:
Blue Pin: Planned 44 units, shipped 10. A 77% shortfall.
Orange Pin: Planned 74 units, shipped 74. Right on target.
Steel Fastener: Planned 39 units, shipped 38. Essentially flat.
Blue Pin had a supplier issue. You could only fulfill 22% of planned orders.
That single product drove the entire volume miss. Everything else was on track.
💡 Pro Tip: Never stop at the total. A volume variance is only useful when you know which SKUs caused it.
The Mix Effect: The Accidental Discovery
Mix Effect: +$935
This is where it gets interesting.
Mix effect measures what happens when customers shift between products. If they move toward higher-priced items, mix is favorable. If they move toward cheaper items, mix is unfavorable.
Your mix effect was +$935—almost a thousand dollars favorable.
How? Your customers who couldn't get Blue Pin didn't leave. They switched.
Look at the SKU-level mix effects:
Product Mix Effect
Red Pin +$2,278 Blue Pin -$3,681 Orange Pin +$122 Steel Fastener +$1,698
Blue Pin's mix effect was -$3,681 (customers didn't buy it). But Red Pin's was +$2,278 and Steel Fastener added +$1,698.
Red Pin sells for $220. Blue Pin sells for $110. Customers who couldn't get their usual $110 product paid $220 for the alternative—without complaint.
The stockout accidentally revealed something your forecast never would have: you'd been underestimating what customers would pay for premium products.
The Price Effect: Small Accommodations
Price Effect: -$269
During the Blue Pin crisis, you made some pricing accommodations. Small discounts here and there to keep customers happy during the disruption.
The price effect shows these decisions cost $269 in revenue.
At the SKU level:
Orange Pin: +$809 (actually increased price realization)
Medium Bolts: +$81 (slight premium)
Large Bolts: -$135 (small discount)
Plastic Fastener: -$135 (accommodation)
The price effect was minor. You didn't panic and slash prices. You made surgical accommodations.
The Strategic Insights
Now let's answer your CFO's real question: What do we do with this information?
Insight #1: Blue Pin Dependency Was a Hidden Risk
Your second-best product by volume represented a single point of failure. When it went down, your quarter nearly went with it. The mix shift saved you—but that was luck, not strategy.
Action: Evaluate supplier diversification for critical SKUs. Model what happens if any top-5 product has a 50%+ supply disruption.
Insight #2: Customers Value Premium More Than You Thought
Red Pin at $220 wasn't a hard sell when Blue Pin at $110 wasn't available. Customers switched up, not down. Steel Fastener at $110 gained share over Plastic at $50.
Action: Test premium positioning. Train sales on value-based selling. Consider whether Blue Pin is actually cannibalizing higher-margin products.
Insight #3: Your Pricing Held
Despite the disruption, you only gave up $269 in price effect. That's discipline. You didn't panic.
Action: Document this as a case study for future disruptions. Your team made good calls under pressure.
How to Build This Analysis
Here's the framework for calculating each effect:
Volume Effect
(Actual Units - Budget Units) × Budget Price × Budget Mix %This isolates how many units you sold versus planned, holding price and mix constant.
Mix Effect
(Actual Mix % - Budget Mix %) × Actual Units × Budget PriceThis captures the shift in product mix, using actual units but budget prices.
Price Effect
(Actual Price - Budget Price) × Actual UnitsThis measures pure price realization on what you actually sold.
⚠️ Watch Out: The order matters. Different calculation sequences give slightly different results. Be consistent with your methodology and document it.
The Bigger Picture
PVM analysis transforms you from a reporter to a diagnostician.
Without it, your conversation with the CFO goes like this:
"We beat budget by $162." "Why?" "Revenue was higher than expected." "..."
With it:
"We beat budget by $162, but the story underneath is important. We had a major supply disruption in Blue Pin that cost us $503 in volume. But customers shifted to premium products, creating a $935 favorable mix effect. The stockout revealed that we may be over-relying on a mid-tier product when customers actually value premium. I recommend we test premium positioning next quarter."
That's the difference between FP&A and strategic finance.
Your Turn
I've attached the complete variance analysis template from this case study.
Download it. Open the data. See if you can find the three strategic insights we discussed—and maybe one or two I missed.
Then ask yourself: What would you recommend to the CFO?
